Tag Archives: Workload

Visualizing Cloud Traces

We commonly need to debug an implementation of a new cloud component. While a torrent of error messages in the system logs communicates the fact that the experiment did not work the way it was intended to, it is harder to determine exactly why this is the case. This becomes especially bad when the cause isn’t a simple programming flaw, but an issue with the scheduling logic or algorithm itself.

A recent example for this was a scheduler which uses machine learning techniques to enforce SLAs, i.e. guarantees to the user of the instances, on the termination rates of evictable (“pre-emptible”) spot instances in IaaS clouds. In our model “spot instance” requests arrive at a cloud from “outside” and execute on spare capacity on the nodes. If the cloud receives high-priority “internal” instance requests which cause resource demand to spike, the spot instances are terminated to make room for more important ones. While I feel the itch to go on about the the scheduler in detail, I’ll rather focus on the problem at hand:

The scheduler performs smoothly for two thirds of a trace we chose for testing and then fails spectacularly, just to return to back to normal towards the end of the experiment. Of course, the primary goal now is to understand what is going on (and going wrong) in the cloud. In addition to the classic “CDF-everything” approach, I find that I frequently come back to two visualization methods for the dynamic behavior of cloud workloads – the utilization graph and the lifetime graph. Representing the inner workings of a cloud in a visual format helps me immensely to interpret the information quickly.

The following graphs are generated from the Eucalyptus private IaaS traces published recently, more specifically the “constant” workload data sets DS5 and DS6. These cloud workload traces are insofar interesting as they are recorded from commercial production systems and cover continuous multi-month time frames. Using the aforementioned types of graphs we will be able to dig up interesting details about the traces and solve the mystery of the failing SLA enforcement.

(A) The utilization graph

trace_utilization

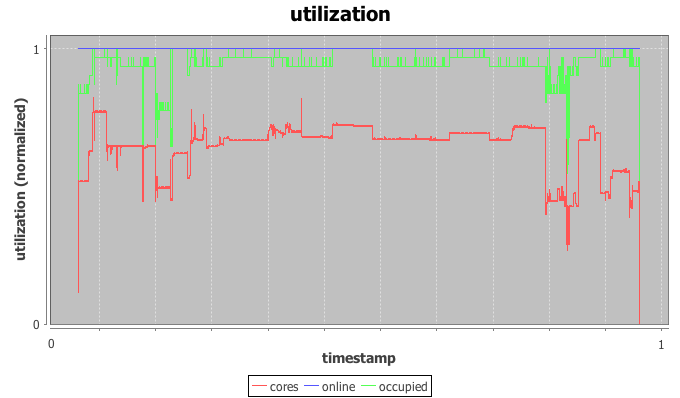
The utilization graph I’m using here is a time-series graph with time on the x-axis and three series plotted on the normalized y-axis: utilization of CPU cores by IaaS instances in red, occupancy of physical hosts by instances in green, and the (here irrelevant) power state of the physical hosts in blue.

Most helpful to our investigation is the red core utilization series. The trace indeed appears constant for most of the trace with a load spike plus a dip in the beginning, a short burst in the middle and another dip followed by a spike towards the end. The beginning of the trace is used as warmup-period for the machine learning scheduler and we’ll ignore it for now. The spike in the middle doesn’t throw off the scheduler, but the dip-spike formation towards the end matches with the timestamps of the observed SLA violation.

In more detail, both node utilization and node occupancy show an extreme outlier within the valley to the right. While our look at the utilization graph confirms that “something” is going on here, it is not immediately clear why this causes the scheduler to trip. After all, the load drops for a moment just to return back to normal levels.

(B) The lifetime graph

trace_lifetimes

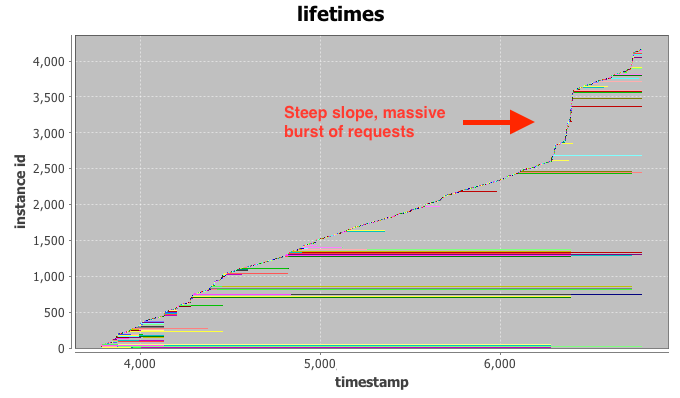
The lifetime graph integrates a large amount of information, so please bear with me for a moment. Time is plotted again on the x-axis while the y-axis represents the instance index (details below). Each horizontal row (“life-line”) represents the lifetime of a single IaaS instance, broken down into three phases: setup, execution, and tear down. Finally, the color-coding is connected to the requesting user, but not relevant for our investigation at hand.

Intuitively, the vertical ordering of rows can be interpreted as their launch order, i.e. instances closer to the bottom of the graph launched before instances towards the top. The horizontal indent of each row visualizes the absolute delay of the instance launch from the very beginning of the trace.

Even with the bare eye you can typically identify clusters of instances with similar start- and stop-times, as they tend to group together in the graph. Examples for this are the long green cluster and the long red cluster in the bottom half of the graph. If a number of these request clusters start or terminate at the same time stamp, such as right after time stamp 4.000, this is a strong indication for a change-point in system (or user) behavior. We can already observe that a number of long-running instances stop at the same time around the 7.000 mark, just when our SLA enforcement fails.

The final hint comes from the line created by newly added instance life-lines. For two thirds of the trace the “slope” generated by new lines is relatively even, indicating a constant arrival rate of requests at the could. This is what we would expect to see from the “constant” workload DS5 and DS6. At the 7.000 mark, however, the slope increases to almost vertical. This is the fingerprint of a massive burst of requests arriving at the cloud at once. Most of the launched instances only execute for a very short period of time and requests end up being issues quickly. This incident has the appearance of a runaway script that is supposed to replace some of the terminated long-running instances, but enters a rapid-fire request loop when failing to launch instances repeatedly.

The initial drop in load causes the scheduler to launch additional spot instances in the systems. While the runaway script ramps up its request rates, more and more spot instances are launched, just to be immediately terminated by a flood of high-priority requests. Armed with this knowledge we are able to solve the mystery of our failing scheduler. We modify it to detect drastic surges and stay at the side-lines until the situation normalizes. More importantly however, I hope that the visualization methods presented above will help you with your quest for building the perfect cloud or, at least, catastrophe-free schedulers. Happy hacking.
Cloud Traces and Production Workloads for Your Research

Only interested in the raw trace data? Skip to the end.

(EDIT 2022-07-14: added Alibaba GPU and micro-services traces. H/T Yuyang Wang)
(EDIT 2022-07-14: added Chameleon Cloud traces. H/T Maël Madon)
(EDIT 2021-06-09: added new Azure Traces (2019, 2020, Serverless, DNN training). H/T Apoorve Mohan)
(EDIT 2021-06-09: added new Google Traces (2019). H/T Apoorve Mohan again, and again)
(EDIT 2021-06-09: add IBM docker registry paper. H/T Yue Cheng)

(EDIT 2021-06-09: Thank you to the many contributors and commenters! Without your help, this awesome collection wouldn’t have happened. Special thanks to Apoorve Mohan, Dachuan Huang, Saurabh Jha, Yue Cheng, and the folks at ResearchGate. Full change log at the bottom)

Whenever there’s a new idea for a cloud scheduler, my first step is a quick draft of the algorithm in an IaaS cloud simulation framework – punching out every idea on a production system simply isn’t feasible. The simulator then needs to be fed with platform configuration about system hardware and some type of utilization trace. The easiest type of workload trace to look at is generated from synthetic distributions, but this has some limitations. The traces we work with at minimum contain (a) job start times, (b) a type of job size such as duration or amount of data to process, and (c) a job type such as the instance type other form of constraint. When I speak of workload traces in this article, I am specifically referring to traces of batch jobs with fixed units of work. As an example, for one of our recent papers about SLA-enforcement for IaaS spot instances this means in detail:

  • request timestamp
  • instance life-time
  • instance core count
  • any additional data …

Generating realistic cloud workloads synthetically has spawned an entire branch of research. My focus in this article is rather a practical description of the steps I personally take for developing and evaluating a new cloud scheduler.

I usually start with a synthetic trace with job inter-arrival times and durations generated from an exponential distribution, with uniform core size – in our example a core count of 1 – for all requests. If the new scheduler doesn’t provide satisfactory results with this, it’s back to the drawing board. The next stage uses a log-normal distribution for arrival and duration, as this better models the long-tail properties of jobs encountered in real-world traces. A last extension for the synthetic traces then is the introduction of a non-homogeneous mix of instance sizes – which has been the demise of quite a few ideas. While the synthetic approach is a useful basic for testing, it does not re-create the kind of challenges that production traces pose, such as change-points in user-behavior, time-varying auto-correlation, and seasonality in the workload.

When a scheduler prototype enters serious consideration, I am a strong proponent of using traces recorded from production systems for evaluation. Unfortunately, this is where evaluation becomes difficult. Besides handling the technological complexity of the scheduler, a logistical problem comes up: the scarcity of publicly available production traces. This can be a big challenge for the aspiring cloud researcher. I’ve listed a number of notable exception below, but generally companies in the cloud space either do not record utilization traces over the long-term or they heavily guard these traces and rarely allow the interested researcher a glimpse. If researchers do get access, they often cannot name the source of the traces and cannot re-distribute the raw data used as foundation for their work. This in turn creates problems with the reproducibility of results and slows down the overall innovation process. The desire to protect a company’s competitive edge is understandable, and yet the availability of anonymized traces would spark innovation and drastically support academic research.

Fortunately, there are exceptions to this rule of scarcity. Here is a selection of public traces that we have found valuable in testing the real-world suitability of cloud schedulers:

Alibaba GPU traces. The released trace contains a hybrid of training and inference jobs running state-of-the-art ML algorithms. It is collected from a large production cluster with over 6,500 GPUs (on ~1800 machines) in Alibaba PAI (Platform for Artificial Intelligence), spanning the July and August of 2020.

Alibaba Micro-Services traces. The released traces contain the detailed runtime metrics of nearly twenty thousand microservices. They are collected from Alibaba production clusters of over ten thousand bare-metal nodes during twelve hours in 2021.

Chameleon Cloud traces. Data from OpenStack Nova/Blazar/Ironic services, as well as software to extract the appropriate data. The chameleon data spans samples from 2017 to 2020.

Azure Public Dataset. Very large trace of anonymized cloud VMs in one of Azure’s availability zones. Contains cpu and memory utilization plus deployment batch size. Cortez et al. analyze the original trace in their SOSP 17 paper. Microsoft keeps adding over time (2019, 2020, Serverless, DNN training).

Google cluster workload. Published by Google in an effort to support large-scale scheduling research, these traces from a Google data center cell have attracted analysis efforts from a number of researchers in the meantime, e.g. an analysis by Sharma et al.. The trace covers a 1-month time frame and 12.000 machines an includes anonymized job constraint tags. They added a new trace in 2019 as well.

IBM Docker Registry traces. More a server access trace rather than raw VM status, but increasingly relevant with the adoption of kubernetes and containerization. Anwar et al. published the matching paper at USENIX in 2018.

Blue Waters HPC traces. (uses LDMS) Cray Gemini torodial network traces from the NCSA’s Blue Waters cluster. Especially relevant for HPC networking studies. Jha et al. present the trace with their work on Monet.

Mustang and Trinity HPC traces. HPC cluster traces from Los Alamos National Labs. The Mustang trace is a smaller cloud-like trace with node counts and groups ids, whereas the Trinity trace comes from a large-scale super computer with backfill scheduler. G. Amvrosiadis et al. analyze the traces and summarizes the results.

Alibaba Cluster Trace Program. Data center traces for VMs with batch workloads and DAG information. Contains a 12 hour and a longer 8 days trace, with cpu and memory allocation. Lu et al. analyze the trace.

CERIT-SC grid workload. Traces from a cluster running cloud and grid applications on a shared infrastructure. Contains traces with resource foot print, instance groups, and allocated hosts. Klusácek and Parák analyze the trace.

TU Delft Bitbrains traces. Two data sets about VM allocation in a distributed data center focused on financial applications. One trace uses SAN storage, the other has a mixed population. Provides fine-grained cpu, memory, disk, and network utilization data over several weeks. Shen et al. analyze the trace. There are several other traces under “datasets”.

Eucalyptus IaaS cloud workload. Anonymized multi-month traces scraped from the log files of 6 different production systems running Eucalyptus private IaaS clouds. Published as part of a study by Wolski and Brevik. The traces contain start- an stop times for instances, their size and the node allocation as decided by the native scheduler. We added the traces from our IC2E 2015 paper on trustworthy cloud simulation as well.

Yahoo cluster traces. A number of data sets from Yahoo’s production systems. Most notably contains system utilization metrics from PNUTS/Sherpa and HDFS access logs for a larger Hadoop cluster. Additionally provides data sets with file access statistics and time-series for testing anomaly detection algorithms.

Cloudera Hadoop workload. (no trace) Similar to the above with data from production systems of anonymous Cloudera customers and Facebook and analyzed by researchers from UC Berkeley. Unfortunately, the raw data is not available.

OpenCloud Hadoop workload. Taken from a Hadoop cluster managed by CMU’s Parallel Data Lab, these traces provide very detailed insights in the workload of a cluster used for scientific workloads for a 20-month period. Includes timestamps, slot counts, and more. K. Ren et al. investigate the traces in depth.

Facebook Hadoop workload. A number of 1-hour segments from Facebook’s Hadoop traces published as part of UC Berkeley AMP Lab’s SWIM project. Some segments contain arrival times and duration, whereas others provide the amounts of data processed.

Notably, most of these traces stem from Hadoop clusters and are limited to data-mining applications. More generic IaaS-type workloads can be found in the Eucalyptus traces and, potentially, the Google trace. I want to emphasize that these are very different types of batch workloads that can offer interesting insights in the behavior of a cloud system under varying conditions. I hope this short reference provides a jump-off point for both researchers and engineers to get their hands on a broader variety of production traces.

Change Log

(EDIT 2022-07-14: added Alibaba GPU and micro-services traces. H/T Yuyang Wang)
(EDIT 2022-07-14: added Chameleon Cloud traces. H/T Maël Madon)
(EDIT 2021-06-09: added new Azure Traces (2019, 2020, Serverless, DNN training). H/T Apoorve Mohan)
(EDIT 2021-06-09: added new Google Traces (2019). H/T Apoorve Mohan again, and again)
(EDIT 2021-06-09: add IBM docker registry paper. H/T Yue Cheng)
(EDIT 2021-06-09: move change log to the bottom)
(EDIT 2020-02-03: added Blue Waters HPC network traces. H/T Saurabh Jha)
(EDIT 2019-07-04: added Mustang and Trinity HPC traces. H/T Apoorve Mohan, again)
(EDIT 2019-03-11: added Azure and Alibaba traces. H/T Apoorve Mohan)
(EDIT 2018-02-21: added TU Delft Bitbrains and CERIT-SC traces. Via ResearchGate)
(EDIT 2017-08-01: added traces from our IC2E 2015 paper “Using Trustworthy Simulation to Engineer Cloud Schedulers”)
(EDIT 2015-09-15: added Yahoo cluster traces. H/T Dachuan Huang)